With each upgrade, the production buildings allow you to increase certain capacities,
such as: your fleet of usable ships, storage capacity, sailors capacity and regeneration rate,
or they will allow you to increase the rate of production of the essential materials required in the game.
Below, these charts show the rates for each upgrade:
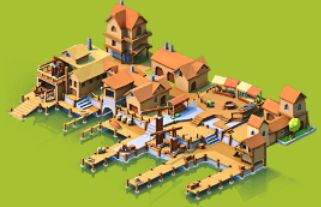
TOWN HALL
(picture here)
size: ↘8 × ↙8
This is the main control building in your port. Increasing the level of the Town Hall will increase the maximum levels of all the other buildings (and the quantity of some) as well as increasing sailor regeneration and capacity.
| Level | Sailor Regeneration | Sailors Max Capacity | Max # of Houses | Max # of Warehouses |
|---|---|---|---|---|
| 1 | 100 | 500 | ||
| 2 | 105 | 510 | 2 | 1 |
| 3 | 110 | 520 | 3 | 2 |
| 4 | 115 | 530 | 4 | 3 |
| 5 | 121 | 540 | 5 | 4 |
| 6 | 127 | 560 | 6 | 5 |
| 7 | 133 | 580 | ||
| 8 | 139 | 600 | ||
| 9 | 146 | 620 | 6 | |
| 10 | 153 | 650 | ||
| 11 | 160 | 680 | ||
| 12 | 167 | 710 | 7 | |
| 13 | 175 | 740 | ||
| 14 | 183 | 780 | ||
| 15 | 191 | 820 | ||
| 16 | 199 | 860 | ||
| 17 | 208 | 900 | ||
| 18 | 217 | 950 | ||
| 19 | 226 | 1000 | ||
| 20 | 235 | 1050 | ||
| 21 | 245 | 1100 | ||
| 22 | 255 | 1160 | ||
| 23 | 265 | 1220 | ||
| 24 | 275 | 1280 | ||
| 25 | 286 | 1340 | ||
| 26 | 297 | 1510 | ||
| 27 | 308 | 1580 | ||
| 28 | 319 | 1650 | ||
| 29 | 331 | 1720 | ||
| 30 | 343 | 1790 | ||
| 31 | 355 | 1860 | ||
| 32 | 367 | 1940 | ||
| 33 | 380 | 2020 | ||
| 34 | 393 | 2100 |
MAIN DOCK

Controls the total size of your usable fleet (number of ships).
|
Level |
Fleet Size |
|---|---|
| 1 | 2 |
| 2 | 3 |
| 3 | 4 |
| 4 | 5 |
| 5 | 6 |
| 6 | 7 |
| 7 | 8 |
| 8 | 9 |
| 9 | 10 |
| 10 | 11 |
| 11 | 12 |
| 12 | 13 |
| 13 | 14 |
| 14 | 15 |
| 15 | 16 |
| 16 | 17 |
| 17 | 18 |
| 18 | 19 |
| 19 | 20 |
| 20 | 21 |
| 21 |
22 |
| 22 | 23 |
| 23 | 24 |
| 24 | 25 |
| 25 | 26 |
| 26 | 27 |
| 27 | 28 |
| 28 | 29 |
| 29 | 30 |
| 30 | 31 |
| 31 | 32 |
| 32 | 33 |
| 33 | 34 |
| 34 | 35 |
| 35 | 36 |
| 36 | 37 |
| 37 | 38 |
| 38 | 39 |
| 39 | 40 |
| 40 | 41 |
HOUSES: (Current maximum = 6)

Control the total capacity AND regeneration rate of sailors.
| Level |
Crew per Hour |
Crew Capacity |
|---|---|---|
| 1 | 10 | 20 |
| 2 | 14 | 30 |
| 3 | 16 | 40 |
| 4 | 20 | 50 |
| 5 | 35 | 60 |
| 6 | 44 | 70 |
| 7 | 54 | 80 |
| 8 | 65 | 90 |
| 9 | 77 | 100 |
| 10 | 90 | 110 |
| 11 | 104 | 120 |
| 12 | 119 | 130 |
| 13 | 134 | 160 |
| 14 | 149 | 190 |
| 15 | 164 | 220 |
| 16 | 180 | 250 |
| 17 |
196 |
280 |
| 18 | 212 | 310 |
| 19 | 228 | 350 |
| 20 | 244 | 390 |
| 21 | 261 | 430 |
| 22 | 278 | 470 |
| 23 | 295 | 520 |
| 24 | 312 | 570 |
| 25 | 329 | 620 |
| 26 | 347 | 670 |
| 27 | 365 | 730 |
| 28 | 383 | 790 |
| 29 | 401 | 850 |
| 30 | 419 | 910 |
| 31 | 438 | 980 |
| 32 | 457 | 1050 |
| 33 | 476 | 1120 |
| 34 | 496 | 1190 |
| 35 | 514 | 1260 |
| 36 | 534 | 1340 |
| 37 | 554 | 1420 |
| 38 | 574 | 1500 |
| 39 | 594 | 1580 |
WAREHOUSES: (Current maximum = 7)
Control the storage capacity of collectable materials required for trading, such as Cocoa and Cloth.
| Level | Capacity |
|---|---|
| 1 | 15 |
| 2 | 20 |
| 3 | 30 |
| 4 | 40 |
| 5 | 55 |
| 6 | 70 |
| 7 | 90 |
| 8 | 110 |
| 9 | 135 |
| 10 | 160 |
| 11 | 190 |
| 12 | 220 |
| 13 | 250 |
| 14 | 285 |
| 15 | 320 |
| 16 | 360 |
| 17 | 400 |
| 18 | 440 |
| 19 | 490 |
| 20 | 540 |
| 21 | 590 |
| 22 | 650 |
| 23 | 710 |
| 24 | 770 |
| 25 | 830 |
| 26 | 900 |
| 27 | 970 |
| 28 | 1040 |
| 29 | 1120 |
| 30 | 1180 |
| 31 | 1260 |
| 32 | 1340 |
| 33 | 1420 |
| 34 | 1500 |
| 35 | 1580 |
| 36 | 1670 |
| 37 | 1760 |
| 38 | 1850 |
| 39 | 1940 |
FISHING PIER
Controls the maximum number of fishing boats AND the rate of fish collected.
|
Level |
Maximum Boats |
Output: Fish |
Time Taken
(Minutes) | |
|---|---|---|---|---|
| per Boat | Max | |||
| 1 | 1 | 48 | 48 | 4 |
| 2 | 2 | 96 | 192 | 8 |
| 3 | 3 | 120 | 360 | 10 |
| 4 | 4 | 120 | 480 | |
| 5 | 4 | 150 | 600 | |
| 6 | 5 | 270 | 1350 | 15 |
| 7 | 315 | 1575 | ||
| 8 | 360 | 1800 | ||
| 9 | 540 | 2700 | 20 | |
| 10 | 600 | 3000 | ||
| 11 | 660 | 3300 | ||
| 12 | 720 | 3600 | ||
| 13 | 1170 | 5850 | 30 | |
| 14 | 1260 | 6300 | ||
| 15 | 1350 | 6750 | ||
| 16 | 1440 | 7200 | ||
| 17 | 2040 | 10 200 | 40 | |
| 18 | 2160 | 10 800 | ||
| 19 | 2280 | 11 400 | ||
| 20 | 2400 | 12 000 | ||
| 21 | 2835 | 14 175 | 45 | |
| 22 | 2970 | 14 850 | ||
| 23 | 3105 | 15 525 | ||
| 24 | 3240 | 16 200 | ||
| 25 | 4125 | 20 625 | 55 | |
| 26 | 4290 | 21 450 | ||
| 27 | 4455 | 22 275 | ||
| 28 | 4620 | 23 100 | ||
| 29 | 5220 | 26 100 | 60 | |
| 30 | 5400 | 27 000 | ||
| 31 | 5580 | 27 900 | ||
| 32 | 5760 | 28 800 | ||
| 33 | 6940 | 34 700 | 70 | |
| 34 | 7140 | 35 700 | ||
| 35 | 7350 | 36 750 | ||
| 36 | 7560 | 37 800 | ||
| 37 | 8800 | 44 000 | 80 | |
| 38 | 9120 | 45 600 | ||
| 39 | 9360 | 46 800 | ||
| 40 | 9600 | 48 000 | ||
| 41 | 11 070 | 55 350 | 90 | |
| 42 | 11 340 | 56 700 | ||
| 43 | 11 610 | 58 050 | ||
| 44 | 11 800 | 59 000 | ||
| 45 | 13 500 | 67 500 | 100 | |
| 46 | ||||
SAWMILLS: (Current maximum = 2)


Require quantities of fish to produce wood.
| Level |
Input |
Output |
Time Taken (Minutes) |
Efficiency | |
|---|---|---|---|---|---|
| Fish | Wood | per Min | vs Fish | ||
| 1 | 10 | 6 | 0.5 | ||
| 2 | 25 | 16 | 1 | ||
| 3 | 45 | 28 | 1.5 | ||
| 4 | 80 | 50 | 2.5 | ||
| 5 | 200 | 130 | 5 | ||
| 6 | 300 | 220 | 6 | ||
| 7 | 400 | 420 | 7 | ||
| 8 | 500 | 430 | 8 | ||
| 9 | 600 | 630 | 9 | ||
| 10 | 700 | 930 | 10 | ||
| 11 | 1000 | 1330 | 11 | ||
| 12 | 1300 | 1730 | 12 | ||
| 13 | 1700 | 2130 | 13 | ||
| 14 | 2100 | 2500 | 14 | ||
| 15 | 2500 | 2900 | 15 | ||
| 16 | 3100 | 3600 | 16 | ||
| 17 | 3700 | 4300 | 17 | ||
| 18 | 4300 | 5000 | 18 | ||
| 19 | 4900 | 5700 | 19 | ||
| 20 | 5500 | 6400 | 20 | ||
| 21 | 6300 | 7500 | 21 | ||
| 22 | 7100 | 8600 | 22 | ||
| 23 | 7900 | 9700 | 23 | ||
| 24 | 8700 | 10 800 | 24 | ||
| 25 | 9500 | 11 900 | 25 | ||
| 26 | 10 500 | 13 300 | 26 | ||
| 27 | 11 500 | 14 700 | 27 | ||
| 28 | 12 500 | 16 100 | 28 | ||
| 29 | 13 500 | 17 500 | 29 | ||
| 30 | 14 500 | 18 900 | 30 | ||
| 31 | 15 800 | 20 600 | 30 | ||
| 32 | 17 100 | 22 300 | 30 | ||
| 33 | 18 400 | 24 000 | 30 | ||
| 34 | 19 700 | 25 700 | 30 | ||
| 35 | 21 000 | 27 400 | 30 | ||
| 36 | 22 600 | 29 500 | 30 | ||
| 37 | 24 200 | 31 600 | 30 | ||
| 38 | 25 800 | 33 700 | 30 | ||
| 39 | 27 400 | 35 800 | 30 | ||
| 40 | 29 000 | 37 900 | 40 | ||
LUMBER MILL
Require quantities of fish to produce wood.
| Level |
Input |
Output |
Time Taken (Minutes) |
|---|---|---|---|
| Fish | Wood | ||
| 1 | 48 000 | 48 700 | 6h |
| 2 | 67 000 | 69 000 | 6,5h |
| 3 | 86 200 | 87 700 | 7h |
| 4 | 107 800 | 112 300 | 7,5h |
| 5 | 131 400 | 141 000 | 8h |
| 6 | 146 000 | 160 000 | 8h |
| 7 | 162 800 | 182 000 | 8h |
| 8 | 178 000 | 202 000 | 8h |
| 9 | 202 000 | 230 000 | 8h |
| 10 | 235 000 | 269 000 | 8h |
| 11 | 269 000 | 307 000 | 8h |
| 12 | 309 000 | 354 000 | 8h |
| 13 | 351 000 | 401 000 | 8h |
QUARRY: (Current maximum = 1)


Requires quantities of fish to produce stone.
| Level |
Input |
Output |
Time Taken (Minutes) |
|---|---|---|---|
| Fish | Stone | ||
| 1 | 100 | 10 | 5 |
| 2 | 250 | 28 | 7.5 |
| 3 | 450 | 68 | 10 |
| 4 | 800 | 92 | 12.5 |
| 5 | 1000 | 120 | 15 |
| 6 | 1200 | 150 | 17.5 |
| 7 | 1400 | 180 | 20 |
| 8 | 1600 | 215 | 22.5 |
| 9 | 1800 | 265 | 25 |
| 10 | 2300 | 325 | 27.5 |
| 11 | 2600 | 400 | 30 |
| 12 | 3000 | 480 | 32.5 |
| 13 | 3500 | 570 | 35 |
| 14 | 4000 | 660 | 37.5 |
| 15 | 4600 | 780 | 40 |
| 16 | 5000 | 890 | 42.5 |
| 17 | 5500 | 1060 | 45 |
| 18 | 6000 | 1220 | 47.5 |
| 19 | 6500 | 1380 | 50 |
| 20 | 7000 | 1540 | |
| 21 | 7500 | 1700 | |
| 22 | 8100 | 1950 | |
| 23 | 8700 | 2200 | |
| 24 | 9300 | 2450 | |
| 25 | 9900 | 2700 | |
| 26 | 10 500 | 2960 | |
| 27 | 11 200 | 3300 | |
| 28 | 11 900 | 3650 | |
| 29 | 12 600 | 4000 | |
| 30 | 13 300 | 4350 | |
| 31 | 14 000 | 4700 | |
| 32 | 14 800 | 5150 | |
| 33 | 15 600 | 5600 | |
| 34 | 16 400 | 6050 | |
| 35 | 17 200 | 6500 | |
| 36 | 18 000 | 6950 | |
| 37 | 18 900 | 7500 | |
| 38 | 19 800 | 8050 | |
| 39 | 20 700 | 8600 | |
| 40 | 21 600 | 9150 | |
| 41 | 22 500 | 9700 |
MINE
Requires quantities of fish to produce stone.
| Level |
Input |
Output |
Time Taken (Minutes) |
|---|---|---|---|
| Fish | Stone | ||
| 1 | 36 000 | 5600 | 6h |
| 2 | 43 000 | 7500 | 6,5h |
| 3 | 54 000 | 11 500 | 7h |
| 4 | 67 000 | 15 400 | 7,5h |
| 5 | 80 500 | 19 800 | 8h |
| 6 | 91 000 | 24 500 | |
| 7 | 102 000 | 29 000 | |
| 8 | 126 000 | 34 500 | |
| 9 | 138 000 | 40 600 | |
| 10 | 142 000 | 46 600 | |
| 11 | 152 000 | 54 000 | |
| 12 | 166 000 | 61 800 |
FOUNDRY: (Current maximum = 1)

Requires quantities of fish to produce iron.
| Level |
Input |
Output |
Time Taken
(minutes) |
Efficiency | |
|---|---|---|---|---|---|
| Fish | Iron | per Min | vs FIsh | ||
| 1 | 1000 | 50 | 15 | 3.3 | 5.0% |
| 2 | 1500 | 80 | 20 | 4.0 | 5.3% |
| 3 | 2000 | 110 | 25 | 4.4 | 5.5% |
| 4 | 2500 | 150 | 30 | 5.0 | 6.0% |
| 5 | 3000 | 200 | 35 | 5.7 | 6.7% |
| 6 | 3500 | 250 | 40 | 6.3 | 7.1% |
| 7 | 4000 | 300 | 45 | 6.7 | 7.5% |
| 8 | 4600 | 380 | 50 | ||
| 9 | 5200 | 460 | 55 | ||
| 10 | 5800 | 540 | 60 | ||
| 11 | 6400 | 620 | 65 | ||
| 12 | 7000 | 700 | 70 | ||
| 13 | 7700 | 820 | |||
| 14 | 8400 | 940 | |||
| 15 | 9100 | 1060 | |||
| 16 | 9800 | 1180 | |||
| 17 | 10 500 | 1300 | |||
| 18 | 11 300 | 1470 | |||
| 19 | 12 100 | 1640 | |||
| 20 | 12 900 | 1810 | |||
| 21 | 13 700 | 1980 | |||
| 22 | 14 500 | 2150 | |||
| 23 | 15 400 | 2380 | |||
| 24 | 16 300 | 2610 | |||
| 25 | 17 200 | 2840 | |||
| 26 | 18 100 | 3070 | |||
| 27 | 19 000 | 3300 | |||
| 28 | 20 000 | 3590 | |||
| 29 | 21 000 | 3880 | |||
| 30 | 22 000 | 4170 | |||
| 31 | 23 000 | 4460 | |||
| 32 | 24 000 | 4750 | |||
| 33 | 25 000 | 5050 | |||
| 34 | 26 400 | 5450 | |||
| 35 | 27 600 | 5800 | |||
| 36 | 28 800 | 6150 | |||
FORGE
Require quantities of fish to produce iron.
| Level |
Input |
Output |
Time Taken (Minutes) |
|---|---|---|---|
| Fish | Iron | ||
| 1 | 34 000 | 3300 | 6h |
| 2 | 46 800 | 5100 | 6,5h |
| 3 | 58 000 | 6900 | 7h |
| 4 | 70 000 | 8900 | 7,5h |
| 5 | 83 500 | 11 300 | 8h |
| 6 | 93 500 | 13 500 | |
| 7 | 103 500 | 15 700 | |
| 8 | 114 000 | 18 400 | |
| 9 | 125 000 | 21 200 | |
| 10 | 136 000 | 24 000 | |
| 11 | 150 000 | 27 600 |
WORKSHOP: (Current maximum = 1)
Requires quantities of fish and iron to produce MECHANICAL PARTS
| Level |
Input |
Output: Mechanical Parts |
Time Taken (Minutes) |
Efficiency | |||
|---|---|---|---|---|---|---|---|
| Fish | Iron | per Min | vs Fish | vs Iron | |||
| 1 | 4000 | 5000 | 100 | 2h | 0.83 | 2.5% | 2.0% |
| 2 | 5000 | 5800 | 125 | 2h 10 min | 0.96 | 2.2% | |
| 3 | 6000 | 6600 | 150 | 2h 20 min | 1.07 | 2.3% | |
| 4 | 7000 | 7400 | 175 | 2h 30 min | 1.17 | 2.4% | |
| 5 | 8000 | 8200 | 200 | 2h 40 min | 1.25 | 2.4% | |
| 6 | 9000 | 9100 | 225 | 2h 50 min | 1.32 | 2.5% | |
| 7 | 10 000 | 10 000 | 250 | 3h | 1.39 | 2.5% | |
| 8 | 11 000 | 11 000 | 275 | 3h | |||
| 9 | 12 000 | 12 000 | 300 | 3h | |||
| 10 | 13 000 | 13 000 | 325 | 3h | |||
| 11 | 14 000 | 15 000 | 350 | 3h | |||
| 12 | 15 000 | 17 000 | 375 | 3h | |||
MUSEUM
For information about the Museum, please refer to the Museum page.